LLDB
LLDB is a debugger that allows you to monitor and change a program as it is running. For example, it allows you to pause a process when a condition is reached, execute a function step by step or even change the value of a variable at runtime.
You can use it for a wild variety of tasks. It even has an API for the more complex use case. We will, however, only cover the basis needed to get you started. Checkout the resources if you want to dive deeper.
Starting LLDB
LLDB works by targeting a specific process. Usually, it is done by connecting to an existing one, but you do not have the required rights to do so on 42’s computers.
The other way is to make LLDB start the process itself. You can define the program to launch when starting the lldb command or with the target create command once you are in the console.
$ lldb my_program
# or
$ lldb
(lldb) target create my_program
Once the program to run is defined, you can start it by running the process launch command, or the aliases r or run.
(lldb) process launch
# or
(lldb) run
# or
(lldb) r
Arguments
Passing arguments to your program if often required, you can do it by adding -- after the LLDB command and options.
$ lldb -- my_program arg1 arg2
# or
(lldb) process launch -- my_program arg1 arg2
It is also possible to add them through the settings command once you are in the console.
(lldb) settings set -- target.run-args "hello world"
Examples
Help & Documentation
LLDB has a great documentation system available at anytime with the help command. By default, it will dump the list of all available commands and some relevant aliases.
(lldb) help
To get more information on a specific command or alias, you can pass it as an argument.
(lldb) help source
Commands for examining source code described by debug information for the current target process.

Syntax: source <subcommand> [<subcommand-options>]

The following subcommands are supported:

      info -- Display source line information for the current target process.  Defaults to instruction pointer in current stack frame.
      list -- Display source code for the current target process as specified by options.

For more help on any particular subcommand, type 'help <command> <subcommand>'.
(lldb) help r
Launch the executable in the debugger.

Syntax: r [<run-args>]

Command Options Usage:
  r [<run-args>]


'r' is an abbreviation for 'process launch -c /usr/bin/zsh --'
Suggestions
Like ZSH or Bash, LLDB has a suggestion system available with the TAB key. If you want to know which commands, options or arguments is available at anytime, press the TAB key and it will show you multiples suggestions or it will automatically complete what you typed if it is the only option.
(lldb) process con
Available completions:
    connect  -- Connect to a remote debug service.
    continue -- Continue execution of all threads in the current process.
Apropos
If you do not remember the exact name of what you are searching for, the apropos command will search all the documentation for the specified word(s).
(lldb) apropos remove
The following commands may relate to 'remove':
  renderscript kernel breakpoint all -- Automatically sets a breakpoint on all renderscript kernels that are or will be loaded.
                                        Disabling option means breakpoints will no longer be set on any kernels loaded in the future, but does not remove currently set breakpoints.
  settings remove                    -- Remove a value from a setting, specified by array index or dictionary key.
  thread plan prune                  -- Removes any thread plans associated with currently unreported threads.  Specify one or more TID's to remove, or if no TID's are provides, remove threads for all unreported threads
Inspect & Modify
LLDB also gives you the ability to inspect the state of a process and even to change it.
Variables
You can use the frame variable or v command to inspect the variables in the current stack frame.
(lldb) frame variable
(char *) str = 0x00007fffffffc70d "hell0 w0rld"
(size_t) len = 11
Simple operations like &, *, ->, [] can be used to access the variables values.
(lldb) frame variable str[3]
(char) str[3] = 'l'
You can access global variables with the --show-globals flag.
The --format option can change how the values are displayed.
# Display the value in hexadecimal
(lldb) frame variable --format hex len
(size_t) len = 0x000000000000000b
# Display the value in binary
(lldb) frame variable --format binary len
(size_t) len = 0b0000000000000000000000000000000000000000000000000000000000001011
The list of all the formats can be found with the help format command.
Expressions
You can use expressions with the expressions or e commands. They allow you to execute arbitrary code in the current stack frame of the process. You can change the value of any variable, create new ones, call functions, etc. without re-compiling or restarting the program.
The value returned by an expression is stored in a variable, in the format $n and can be reused.
(lldb) expression 1 + 1
(int) $0 = 2
(lldb) expression $0 + 1
(int) $1 = 3
(lldb) expression $0 + $1
(int) $2 = 5
# Get the value of the variable str
(lldb) expression str
(char *) $0 = 0x00007fffffffc70d "hell0 w0rld"
# Call the funtion sprintf
(lldb) expression (int)sprintf(str, "hello world")
(int) $1 = 11
(lldb) v str
(char *) str = 0x00007fffffffc70d "hello world"
# Change the value of the variable str
(lldb) expression str = "hi earth"
(char *) $2 = 0x00007ffff7fbe420 "hi earth"
(lldb) v str
(char *) str = 0x00007ffff7fbe420 "hi earth"
You can even write multi-line expressions by pressing the Return after an empty expression.
(lldb) expression
Enter expressions, then terminate with an empty line to evaluate:
  1: line 1
  2: line 2
  3: ...
Stopping the process
In order to inspect or change the state of your program, you will first need to stop it.
By default, this will only happen if an exception is raised or a stopping signal such as SIGKILL is received. If you want to stop the program at a specific point in the program, you will need to use breakpoints through the breakpoint command or its alias br.
If you are stuck in a loop or if you want to stop the program right away, you can use the press CTRL + c to make it stop at the next instruction.
Adding breakpoints
Breakpoints can be added to various types of targets, such as functions, lines of code, regex.
You can find the list of all the options with the help breakpoint set command, but the most common ones are:
# Set a breakpoint in file main.c at line 20 and column 10
(lldb) breakpoint set --joint-specifier main.c:20:10
# Set a breakpoint on the function main
(lldb) breakpoint set --name main
The alias b is a powerful way to quickly add various types of breakpoints, as it will infer its type based on the arguments you pass. A list of all the argument format is available with the help b command.
# Set a breakpoint in file main.c at line 20 and column 10
(lldb) b main.c:20:10
# Set a breakpoint on the function main
(lldb) b main
# Set a breakpoint on the address 0x1234000
(lldb) b 0x1234000
Conditions
Sometimes you might want your breakpoints to only be triggered when a certain condition is met.
The easiest way is with the --ignore-count option. This will allow you to set the number of time the breakpoint must be hit before it is triggered.
// main.c
int main(void) {
      for (int i = 0; i < 10; i++) {
            printf("%d\n", i);
      }
}
# The breakpoint will be triggered after 2 loop, for when i == 2
(lldb) breakpoint set --line 4 --ignore-count 2
The other way is through the uses of expressions and the --condition option.
# The breakpoint will be triggered when i == 2
(lldb) breakpoint set --line 4 --condition 'i + 5 == 7'
# The breakpoint will be triggered when the first argument passed to the program is 'hello'
(lldb) breakpoint set --name main --condition 'strcmp(argv[1], "hello") == 0'
Watchpoints
Watchpoints are a special breakpoint that will trigger when the value of a variable or an address is changed or read.
You create them with the watchpoint set command. Instead of defining a line or function, you define a variable or an address.
watchpoint set variable takes the name of a variable in the current frame, and watchpoint set expression takes an expression used to evaluate the address.
(lldb) watchpoint set variable -w read_write foo
(lldb) watchpoint set expression -w write -s 1 -- bar + 32
Both variable and expression can take a --size flag to define the number of bytes to watch, and a --watch flag that can be read, write or read_write to define what kind of operation to watch for.
Managing breakpoints
Most commands that act on breakpoints will require their ID as an argument, in order to get it or if you want to see all the existing breakpoints, you can use the breakpoint list command.
(lldb) breakpoint list
When creating breakpoints, you have the possibility to name them with the --breakpoint-name option, which can later be used to more easily find them or to remember why you added them.
(lldb) breakpoint set --line 4 --breakpoint-name "for_loop"
Modifying breakpoints
Existing breakpoints can be modified with the breakpoint modify command.
The main purpose of this command is to change the condition of a breakpoint.
# Add a condition to the breakpoint with the ID 1
(lldb) breakpoint modify --condition 'i + 5 == 7' 1
# Remove the condition from the last added breakpoint
(lldb) breakpoint modify --condition ''
Removing breakpoints
When you no longer need a breakpoint, you can remove it with the breakpoint remove command.
# Remove the breakpoint with the ID 1
(lldb) breakpoint remove 1
# Remove all the existing breakpoints
(lldb) breakpoint remove
If instead you still want to keep the breakpoint for future use, you can disable it with the breakpoint disable command and then use the breakpoint enable command to re-enable it.
# Disable the breakpoint with the ID 1
(lldb) breakpoint disable 1
# Disable all the existing breakpoints
(lldb) breakpoint disable
# Enable the breakpoint with the ID 1
(lldb) breakpoint enable 1
Saving breakpoints
When you quit LLDB all your breakpoints will be lost. If you want to re-use or share them with others, you can save them to a file with the breakpoint write command.
(lldb) breakpoint write --file my_breakpoints
(lldb) breakpoint write --append --file my_breakpoints
Examples
Controlling the process
Once you have stopped the process, you can control it with the thread commands:
thread step-inorswill step into the next function call.thread step-outorfinishwill step out of the current function.thread step-overornwill go to the next instruction, but will not step into functions.thread continueorcwill continue the process until the next breakpoint or the end of the program.
Pressing the Return key with no command will re-execute the last command you used.
If at any point you want to see where you are in the program, you can use the process status command.
(lldb) process status
Process 11582 stopped
* thread #1, name = 'my_program', stop reason = step over
    frame #0: 0x00005555555551c0 my_program`ft_strlen(str="hell0 w0rld") at main.c:12:10
   9
   10   size_t ft_strlen(char *str) {
   11     size_t len = 0;
-> 12     for (; str[len]; ++len);
   13     return len;
   14   }
   15
Call stack
On top of being able to control the process, LLDB also allows you to see and move inside the call stack.
The thread backtrace command will show you the current call stack.
(lldb) thread backtrace
* thread #1, name = 'my_program', stop reason = breakpoint 2.1
  * frame #0: 0x000055555555515a my_program`is_alpha(c='e') at main.c:5:8
    frame #1: 0x0000555555555281 my_program`main(argc=2, argv=0x00007fffffffc308) at main.c:25:11
    frame #2: 0x00007ffff7c29290 libc.so.6`___lldb_unnamed_symbol3123 + 128
    frame #3: 0x00007ffff7c2934a libc.so.6`__libc_start_main + 138
    frame #4: 0x0000555555555075 my_program`_start at start.S:115
You can then use the frame select command to select which frame you want to see.
(lldb) frame select 1
This is extremely useful to understand what appended before the point you currently are in the program and find the cause of the broken state you are currently in.
The up and down commands will also move the call stack up and down.
Examples
GUI mode
LLDB has GUI mode, it is not the most pleasant way to interact with it but it can be useful if you struggle with using the default console.
You can enable it by typing the gui command on the LLDB console. Press h to bring up the help menu or Escape to go back to the console.
(lldb) gui
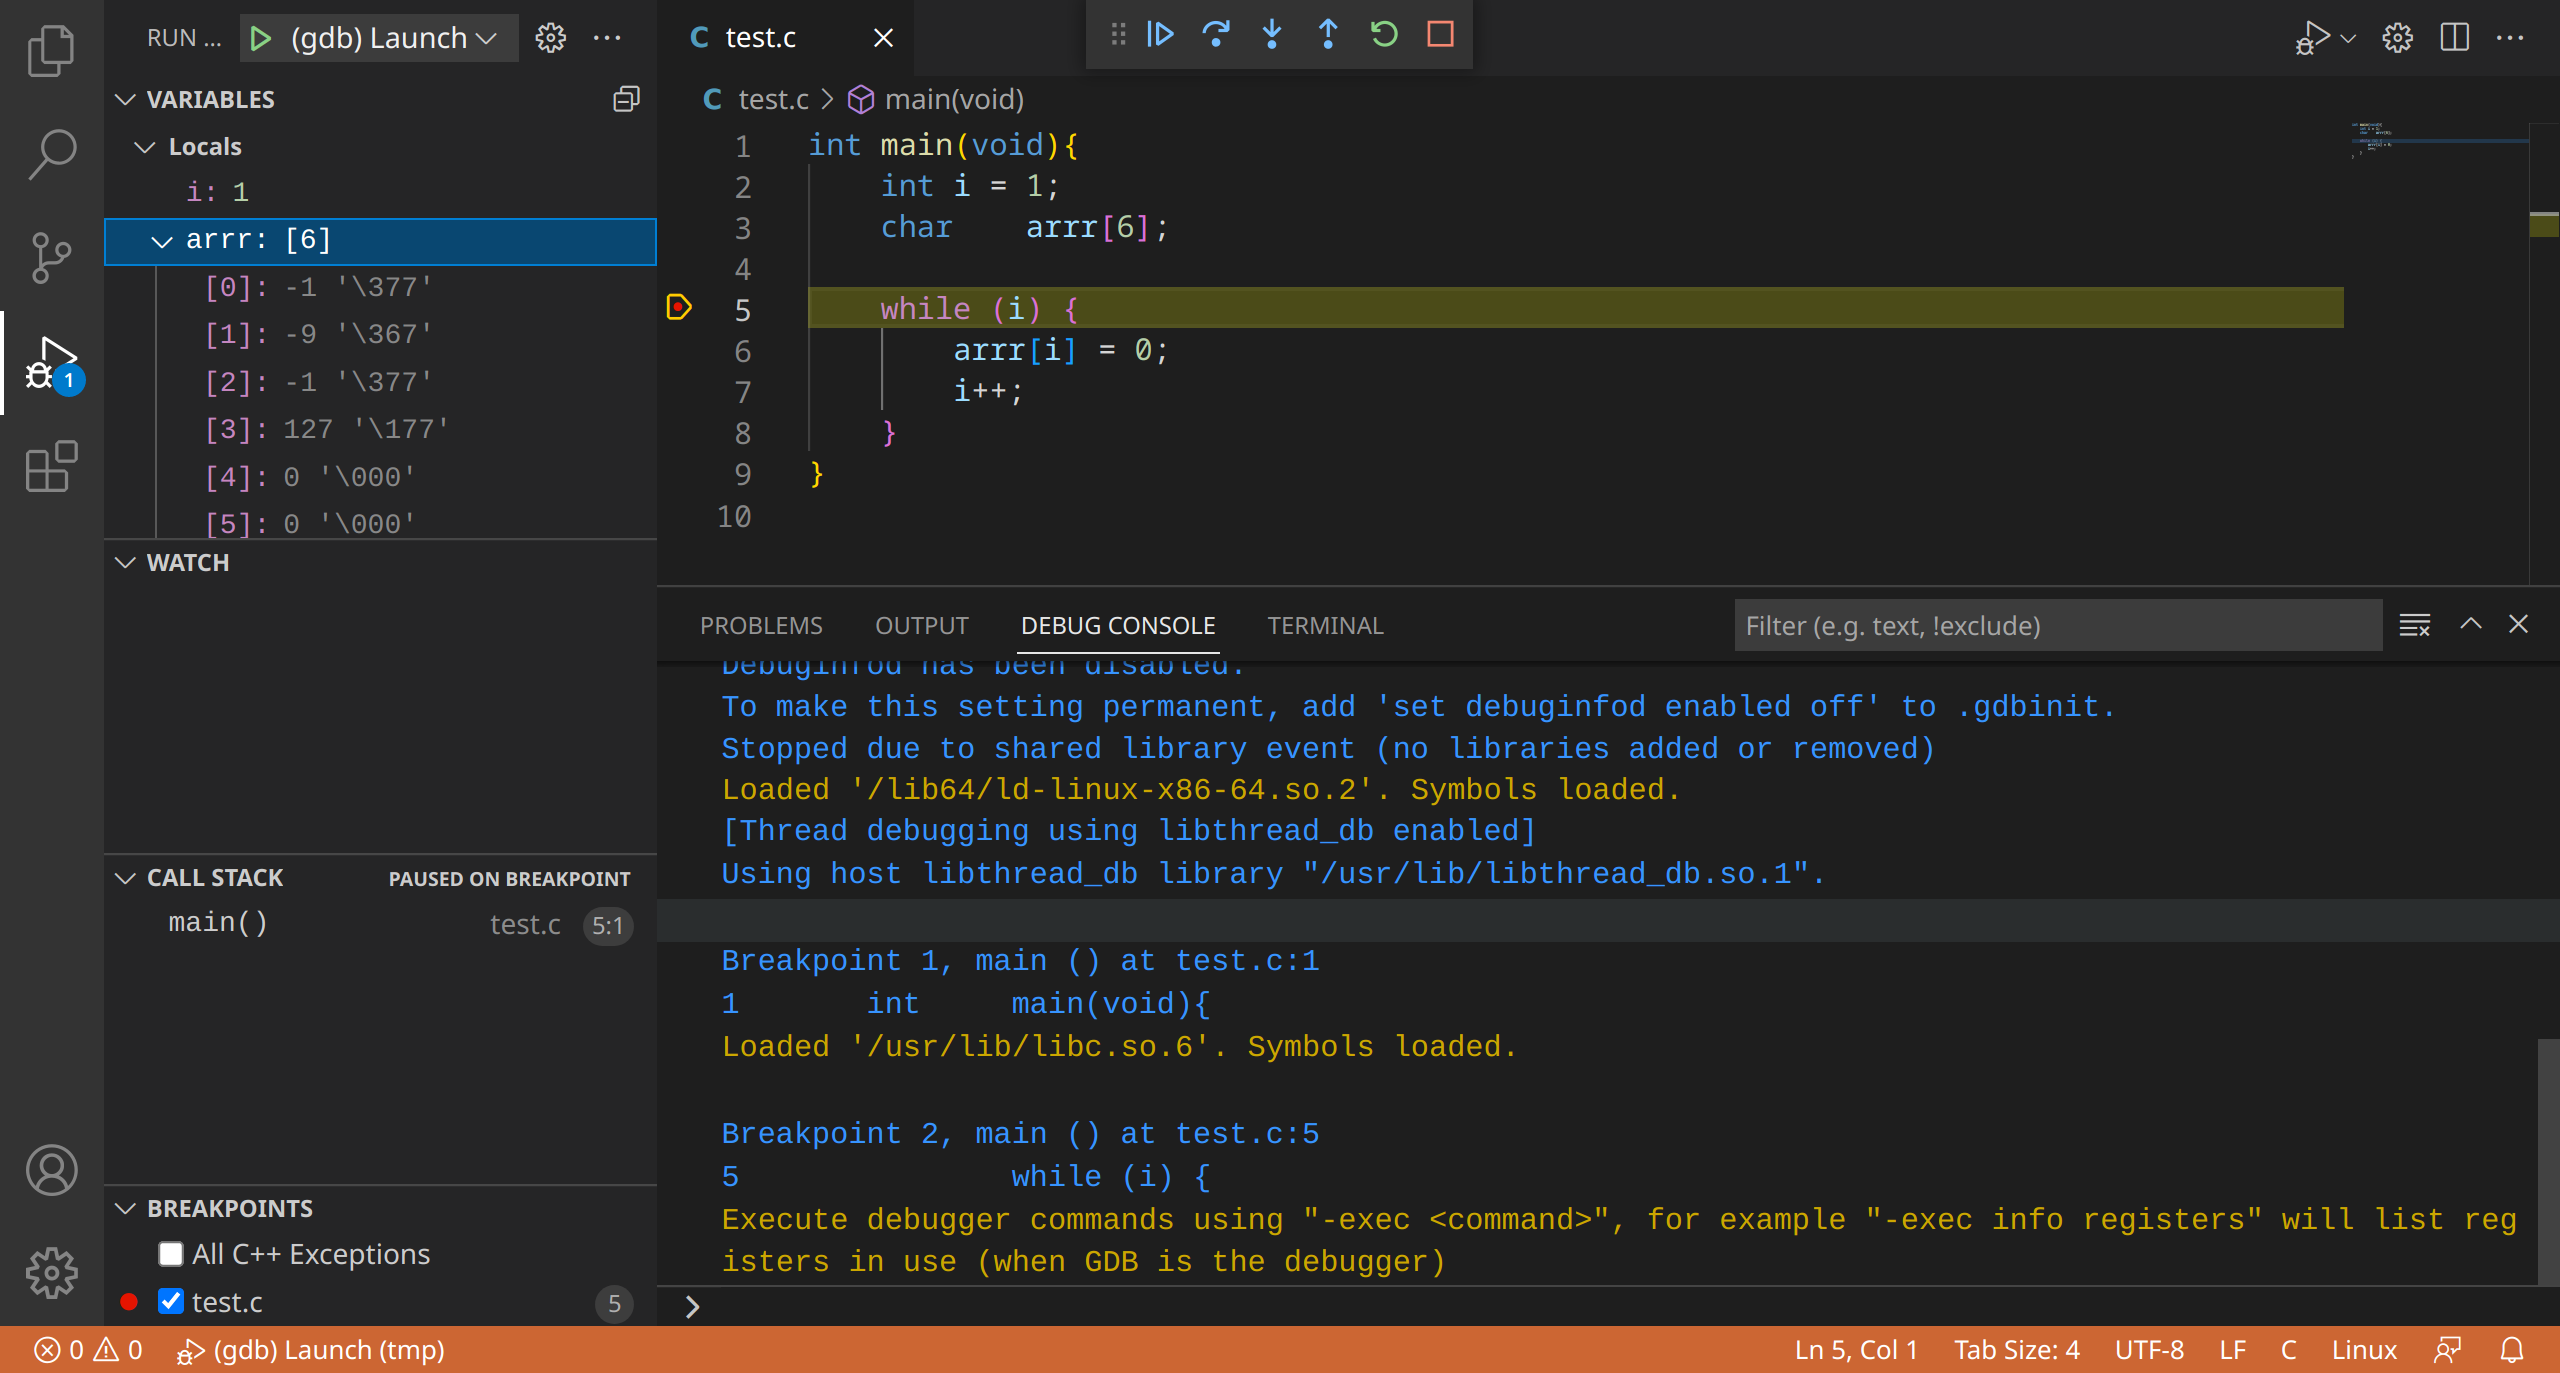
Visual Studio Code
VSCode can interact with LLDB trough the Microsoft C/C++ extention.
It allows you to add or remove breakpoints, inspect variable or the call stack from within your IDE while still keeping access to the LLDB console.
Read VSCode documenation on debugging for more information on how to use it.
Resouces
- https://lldb.llvm.org/use/tutorial.html
- Advanced Apple Debugging & Reverse Engineering - Derek Selander
- https://developer.apple.com/videos/play/wwdc2019/429/